Financial Director's report
 |
| Laurence Cohen, FD |
| Highlights |
 |
| Distribution growth up 7,6% to 213 cpu |
| Net income from shopping centres up 7,2% to R606 million |
| NAV per unit up 9,5% to R68,56 |
| Total assets up 6,8% to R23 billion |
Condensed statement of comprehensive income
| |
Audited
30 June 2013
Rm |
|
Unaudited
30 June 2012
Rm |
|
| Revenue |
1 084 |
|
1 067 |
|
| Investment property |
1 009 |
|
989 |
|
| Listed property |
75 |
|
78 |
|
| Property expenses |
(347) |
|
(351) |
|
| Net property income |
737 |
|
716 |
|
| Other operating expenses |
(26) |
|
(24) |
|
| Operating income |
711 |
|
692 |
|
| Net interest |
(196) |
|
(211) |
|
| Net operating income |
515 |
|
481 |
|
| Atterbury Africa |
1 |
|
|
|
| Non-core income |
1 |
|
|
|
| Net income |
517 |
|
481 |
|
| No. of combined units (000) |
243 113 |
|
243 113 |
|
| Distribution cpu (cents) |
213.0 |
|
198,0 |
|
Introduction
Hyprop has delivered a strong set of results with the regional, large
regional and super regional malls in particular exhibiting resilience. We
continue to maintain a sound balance sheet and have successfully
further diversified our sources of funding. The growth in distribution
is testament to a world-class retail portfolio and in line with our
objective of providing sustainable income growth and capital
appreciation to investors over the long term. Overall, Hyprop is
well positioned to take advantage of increased tenant demand and
maintain the high quality of our shopping centres.
FINANCIAL PERFORMANCE
Distributable earnings from shopping centres grew by 7,2%, despite
dilution from the Rosebank Mall redevelopment. Canal Walk achieved
a strong performance with distributable income up 10,2%. Similarly,
distributable earnings from Hyde Park were up 10,9% period-on-period.
The marginal decrease in distributable earnings from offices
of 6,4% was due to a once-off rental guarantee received in the prior
period.
Rosebank Mall is undergoing a R932 million redevelopment with final
completion expected by September 2014. Despite extensive planned
vacancies and the related disruptions to trading, the centre achieved distributable earnings of R20 million for the period. The dilution in
distributable earnings was in line with budget and is expected to
continue for the next 12 months, while the centre remains under
construction.
Income from listed property securities reduced due to the disposal
of the investments in Vunani and Acucap during 2012. Income from
associates of R4,2 million includes the first dividend from Atterbury
Africa of R1,4 million. Hyprop has a 37,5% shareholding in Atterbury
Africa, which is jointly controlled by Hyprop and the Atterbury
Group. For the period under review, Hyprop increased its investment
by R226 million to R337 million (USD34 million). Hyprop’s initial
commitment is R750 million.
The reduction in net interest paid is primarily due to asset sales of
R524 million during 2012.
Costs were well contained with the property cost-to-income ratio
improving to 34,4% (31 December 2012: 35,4%), while the total cost-to-income ratio at a fund level improved to 34,6% (31 December 2012:
35,4%). Total arrears at 30 June 2013, comprising normal arrears, legal
cases and outstanding tenant deposits, improved to R17,9 million (31
December 2012: R19,8 million) and the total allowance for doubtful
debts was R9,0 million (31 December 2012: R10,2 million).
| |
Revenue spread |
|
|
|
Total net income |
|
| |
 |
|
|
|
 |
|
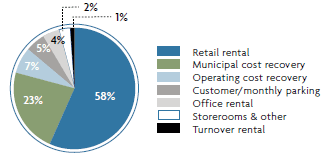
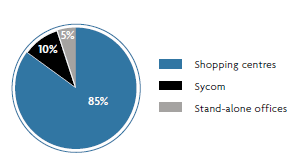
As indicated in the diagram above turnover rental is only 1% of total revenue, which supports the contractual and predictable nature of Hyprop’s
revenue stream. Municipal cost recoveries, which include rates, electricity and other utilities have grown from 13% of total revenue five years ago
to 23% at 30 June 2013, in line with the excessive increases in utility costs over that period. Hyprop has implemented several initiatives to reduce
the consumption of electricity, details of which can be found on page 42 of this report.
Property portfolio
| |
|
|
Value attributable to Hyprop |
|
Value per
rentable area |
|
| Business segment |
Rentable area
(m2) |
|
30 June 2013
R’000 |
|
31 December 2012
R’000 |
|
30 June 2013
(R/m2) |
|
| Canal Walk |
153 531 |
|
5 627 200 |
|
5 200 000 |
|
45 815 |
|
| Super regional |
153 531 |
|
5 627 200 |
|
5 200 000 |
|
45 815 |
|
| Clearwater |
86 031 |
|
3 203 000 |
|
2 945 000 |
|
37 231 |
|
| The Glen |
74 348 |
|
1 854 094 |
|
1 751 130 |
|
33 182 |
|
| Woodlands Boulevard |
71 607 |
|
1 886 000 |
|
1 770 000 |
|
26 338 |
|
| CapeGate |
97 346 |
|
1 602 000 |
|
1 509 000 |
|
16 457 |
|
| Large regional |
329 332 |
|
8 545 094 |
|
7 975 130 |
|
27 808 |
|
| Hyde Park |
37 003 |
|
1 556 000 |
|
1 420 000 |
|
42 051 |
|
| Regional |
37 003 |
|
1 556 000 |
|
1 420 000 |
|
42 051 |
|
| Atterbury Value Mart |
47 745 |
|
987 000 |
|
952 000 |
|
20 672 |
|
| Willowbridge |
44 663 |
|
585 000 |
|
620 000 |
|
13 098 |
|
| Stoneridge |
48 584 |
|
421 200 |
|
432 900 |
|
9 633 |
|
| Somerset Value Mart |
12 386 |
|
185 000 |
|
170 000 |
|
14 936 |
|
| Value centres |
153 378 |
|
2 178 200 |
|
2 174 900 |
|
14 507 |
|
| Shopping centres |
673 244 |
|
17 906 494 |
|
16 770 030 |
|
29 667 |
|
| Stand-alone offices |
52 206 |
|
749 000 |
|
710 000 |
|
14 347 |
|
| Development property(1) |
35 950 |
|
1 187 000 |
|
990 000 |
|
|
|
| Held-for-sale(2) |
|
|
|
|
130 000 |
|
|
|
| Investment property |
761 400 |
|
19 842 494 |
|
18 600 030 |
|
|
|
| Listed property securities(3) |
|
|
2 279 253 |
|
2 282 095 |
|
|
|
| Atterbury Africa |
|
|
336 994 |
|
111 109 |
|
|
|
| |
761 400 |
|
22 458 741 |
|
20 993 234 |
|
|
|
(1) Rosebank Mall - transferred to development property from September 2012
(2) Southern Sun Hyde Park - sold 2012
(3) Sycom (30 June 2013) - held-for-sale
Investment property
Investment property was independently valued by Old Mutual
Investment Group South Africa using the discounted cash flow
method. The investment property portfolio showed good growth
of 6,7% to R19,8 billion, after a fair value adjustment for the period
of R1,2 billion.
The increase in the valuation of the shopping centre portfolio by
6,8% to R17,9 billion was driven primarily by income growth and
reductions in discount rates and cap rates, supported by strong
demand for quality shopping centres.
NET ASSET VALUE
The net asset value per combined unit (“NAV”) including deferred
tax at 30 June 2013 was R68,43, representing a 28,5% increase on the
NAV of R53,25 at 31 December 2012. The substantial increase in NAV
per combined unit was primarily as a result of the elimination of
deferred capital gains taxation, following the conversion to a REIT
on 1 July 2013.
South African REITs are not subject to capital gains taxation on
the disposal of investment property and on the disposal of listed
property securities that are constituted as REITs. Accordingly, at
30 June 2013, Hyprop eliminated accumulated deferred capital
gains taxation applicable to the investment property portfolio and
the investment in Sycom. The deferred capital gains taxation was
eliminated through the statement of comprehensive income, and
resulted in a material increase in earnings, headline earnings and net
asset value per combined unit.
Excluding deferred taxation, the NAV at year-end was R68,56 (31
December 2012: R62,59), a 9,5% increase on the prior year, primarily
due to an increase in the independent valuation of the investment
property portfolio. The closing combined unit price of R78 at
30 June 2013 represents a 13,8% premium to the year-end NAV,
excluding deferred taxation.
BORROWINGS
Net borrowings at 30 June 2013 of R5,1 billion (31 December 2012: R4,9
billion) equate to a gearing ratio of 22,9%, down from 23,1% in 2012.
The lower ratio is mainly due to the increase in valuation of the
property portfolio.
Hyprop views the ideal gearing level as being between 30% and
40%. However, increasing gearing is dependent to a large extent
on corporate activity, particularly acquisitions. In the absence of
significant acquisitions, it is not likely that the gearing ratio will reach
these levels.
At year-end, interest rates were hedged in respect of 87% (31
December 2012: 82%) of borrowings, at a weighted average rate of
8,1% (31 December 2012: 8,4%).
Hyprop increased its debt capital market (“DCM”) issuance in April
2013, with the conversion of R648 million of existing bank debt to
DCM funding. This brings total DCM issuance to R1,6 billion, or 31% of
total borrowings.
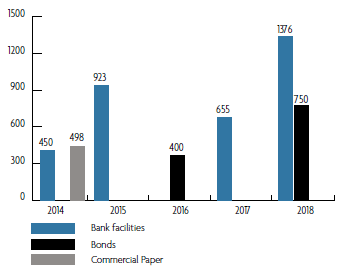
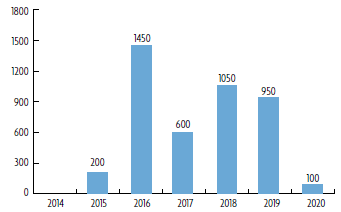
The maturity profile of Hyprop’s various debt facilities, fixed rates
and swaps are depicted in the below graphs.
DEBT MATURITY PROFILE |
|
|
FIXED INTEREST RATE EXPIRY PROFILE
|
|
| BANK FACILITIES AND DCM FUNDING |
|
|
|
|
 |
|
|
 |
|
Appreciation
Hyprop’s change in year-end resulted in two year-ends in the last
six months, materially increasing the financial team’s workload. I
would like to thank them for their dedication and commitment in
this regard. I also wish to extend my appreciation to the board of
directors for their continued advice, guidance and support.
Laurence Cohen
Financial Director
|
