|


|
|
|
|
|
|
|
|
CEO's report
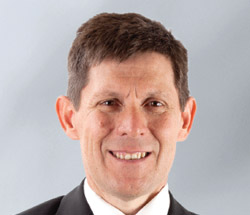 |
| PIETER PRINSLOO, CEO |
| oPerations |
 |
| Strong year-on-year trading density growth at large shopping centres |
| Reduction in vacancies with low vacancies at large shopping centres |
| Above inflation contractual rental escalation |
| Reduced operating cost through the introduction of national service contracts |
| Introduction of new technology at shopping centres |
introduction
The premium quality of Hyprop’s assets and the specialised, experienced internal management team, again proved their worth in a challenging economy, by delivering pleasing results. Hyprop’s unrelenting focus on continuously improving the quality and dominance of its shopping centres, ensured trading density growth in the portfolio. The net result was a distribution growth of 6,8% for unitholders.
The scarcity of quality property assets in South Africa and the readily available debt funding for large listed property funds resulted in yields reaching unprecedented levels, making it very expensive to acquire existing shopping centres. Hyprop’s strategy is therefore focused more on development and expansion of its existing portfolio at acceptable yields.
Operationally, the strongest trading performances were achieved from the super and large regional shopping centres. The value centres mainly recorded lower growth with the exception of Stoneridge shopping centre where vacancies were substantially reduced. Offices continued to be negatively affected by the high vacancy rates but improvements in letting were seen towards the end of the year.
inveStMent in africa
Atterbury Africa purchased a 47% interest in the 20 000m2 Accra Mall in Ghana in anticipation of expanding the centre. in addition it has commenced the development of the West Hills Mall in Accra.
Investment criteria include common national tenants with similar centres in South Africa, and design criteria are on a par with Hyprop’s existing enclosed malls. Most importantly, existing centres and/or new developments in Africa must attain similar quality to Hyprop’s current shopping centres.
deveLopMentS
2012 was an important year for Hyprop’s development programme as the Rosebank Mall redevelopment moved from the planning phase into reality with the commencement of construction in September 2012. The total cost of the redevelopment is estimated at R920 million with an anticipated first year yield of 7%. Rosebank Mall will almost double in size to 62 000m² of lettable area. The mall will trade throughout the construction period with new retail sections being smoothly phased in from as early as the third quarter of 2013. The total development period is 25 months with the anticipated completion date set for September 2014.
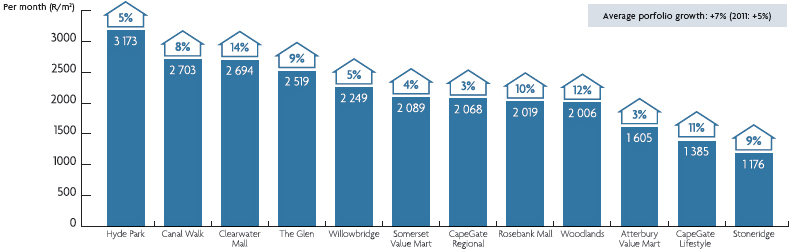
| TRADING DENSITY | ||
 |
Exciting new tenants will be introduced into the centre including anchor tenants such as a Woolworths Platinum store, a double level Edgars store, Dis-Chem, Mr Price Sports and Jet. Existing tenants including Stuttafords, Truworths, Mr Price Weekend, Queenspark and Foschini will all be upgraded or expanded to offer the latest new store concepts and merchandise. Pick n Pay will retain its position in the centre.
There was an increased focus in the portfolio on store enlargements and replacements as retailers are focusing more on creating “flagship” stores in large shopping centres to better showcase their products and grow their brand identities.
The capital spend for the year on store enlargements was R17 million, with the more prominent stores including:
| Tenant | Shopping centre | ||
| Edgars and Jet | Clearwater | ||
| Clicks, Mr Price Sport and Cotton On | Canal Walk | ||
| Spur | Woodlands |
Other refurbishment and redevelopment projects planned for 2013 include enclosing the mall areas at Willowbridge South and the enlargement of the Edgars stores at Canal Walk and The Glen.
During the second half of the year 14 200m² of additional bulk was purchased at the CapeGate regional centre for an amount of R25 million. Medium to long-term expansion plans include additional bulk at Canal Walk, The Glen and Woodlands.
Disposals
In accordance with its strategy to invest in large, prime quality shopping centres, Hyprop continued to dispose of non-core assets during the year. The company will evaluate the quality of the portfolio on an on-going basis with a view to further dispose of assets not meeting the investment strategy. These assets can include free-standing offices and smaller retail buildings.
| Disposals | Proceeds (Rm) | ||
| Vunani units | 105,0 | ||
| Acucap units | 108,5 | ||
| 50% undivided share in Southcoast Mall | 110,5 | ||
| CapeGate Trade Centre | 70,0 | ||
| Southern Sun Hyde Park Hotel * | 130,0 | ||
| Total | 524,0 |
* Awaiting transfer
Trading conditions
Consumer spend remained strong throughout the year with a growing shopper trend towards quality goods at the regional malls. Until recently the retail offering, especially for apparel retailers, was dominated by strong South African brands. However, with the average South African consumer gaining an affinity for international brands, competition in the fashion category is likely to increase. The growing number of international retailers leasing sizable stores in the South African market for the first time has seen the demand for well-located stores in quality regional shopping centres increase significantly. The response from some of the national retailers is to enter into co-operation agreements with the international brands leading to an increase in their store sizes to accommodate these brands. Many are focusing on their top locations and on providing a substantial product offering in large flagship stores. Prominent international brands which have entered the South African market in recent months include Zara, Topshop, Gap and Cotton On.
Letting activity and vacancies
Retail vacancies on a like-for-like basis, excluding the Rosebank Mall redevelopment, improved substantially from 3% at the beginning of the year to 1,7% at year-end. Vacancies at Stoneridge reduced by over 5 000m², which was the highest reduction in the portfolio. Canal Walk, The Glen and CapeGate regional mall had vacancies of less than 1%, while Hyde Park, Clearwater Mall and Woodlands Boulevard were fully let at year-end.
The demand for offices remained under pressure and vacancies at year-end were 9,1% (2011: 12,2%).
Strong interest from prospective tenants has been received for the Rosebank Mall redevelopment, scheduled for completion the second half of 2014, with committed rental offers at over 90% of gross lettable area.
Vacancies
| 31 December 2012 | 31 December 2011 | |||||||
| (m2) | (%) | (m2) | (%) | |||||
| Canal Walk * | 784 | 0,5 | 1 077 | 0,7 | ||||
| Super regional | 784 | 0,5 | 1 077 | 0,7 | ||||
| Clearwater Mall | Nil | Nil | 2 669 | 3,1 | ||||
| The Glen | 345 | 0,5 | 198 | 0,3 | ||||
| Woodlands | Nil | Nil | Nil | Nil | ||||
| CapeGate * | 6 053 | 6,1 | 6 776 | 6,4 | ||||
| Large regional | 6 398 | 1,9 | 9 643 | 2,9 | ||||
| Hyde Park* | 1 010 | 2,7 | 2 133 | 5,8 | ||||
| Southcoast Mall^ | Nil | Nil | 1 836 | 6,3 | ||||
| Regional | 1 010 | 2,7 | 3 969 | 6,0 | ||||
| Willowbridge * | 1 536 | 3,5 | 2 403 | 5,3 | ||||
| Stoneridge | 3 743 | 7,3 | 8 807 | 17,2 | ||||
| Somerset Value Mart | 289 | 2,3 | 130 | 1,0 | ||||
| Atterbury Value Mart | Nil | Nil | 75 | 0,2 | ||||
| Value centres | 5 568 | 3,6 | 11 415 | 5,7 | ||||
| Shopping centres | 13 759 | 2,0 | 26 104 | 3,3 | ||||
| Offices — stand-alone | 4 519 | 8,8 | 4 610 | 9,0 | ||||
| Total | 18 278 | 2,5 | 30 714 | 3,7 | ||||
| * | Includes the office component |
| ^ | Sold during the year |
Lease renewal profile
| By income | 2013 | 2014 | 2015 | 2016 | 2017 + | |
| Canal Walk | 15% | 19% | 35% | 10% | 21% | |
| Clearwater | 6% | 38% | 22% | 9% | 25% | |
| The Glen | 25% | 29% | 11% | 13% | 22% | |
| Woodlands | 9% | 27% | 16% | 9% | 39% | |
| CapeGate | 14% | 11% | 54% | 16% | 5% | |
| Hyde Park | 27% | 29% | 19% | 10% | 15% | |
| Willowridge | 25% | 9% | 29% | 15% | 22% | |
| Stoneridge | 38% | 9% | 16% | 7% | 30% | |
| Somerset Value Mart | 15% | Nil | 15% | 30% | 40% | |
| Atterbury Value Mart | 11% | 24% | 20% | 22% | 23% | |
| Offices | 18% | 18% | 35% | 22% | 7% | |
| Total | 16% | 23% | 27% | 13% | 21% |
| By area | Vacancy | 2013 | 2014 | 2015 | 2016 | 2017 + |
| Canal Walk | 0,2% | 9% | 13% | 38% | 10% | 30% |
| Clearwater | Nil | 3% | 33% | 15% | 6% | 43% |
| The Glen | 0,5% | 26% | 25% | 10% | 12% | 27% |
| Woodlands | Nil | 5% | 25% | 10% | 9% | 51% |
| CapeGate | 5,3% | 11% | 11% | 49% | 16% | 8% |
| Hyde Park | Nil | 19% | 34% | 13% | 5% | 29% |
| Willowbridge | 3,5% | 21% | 6% | 24% | 20% | 25% |
| Stoneridge | 7,3% | 34% | 8% | 15% | 7% | 29% |
| Somerset Value Mart | 2,3% | 21% | Nil | 11% | 31% | 35% |
| Atterbury Value Mart | Nil | 11% | 24% | 20% | 29% | 16% |
| Offices | 9,1% | 17% | 17% | 31% | 20% | 6% |
| Total | 2,5% | 14% | 19% | 25% | 13% | 27% |
LEASE ACTIVITY
| Retail | Area (m2) |
Rental growth (%) |
Contractual escalation (%) |
||
| New lettings | 34 134 | 3,5 | 8,9 | ||
| Renewals | 61 161 | 4,4 | 8,4 | ||
| Total | 95 295 | 4,1 | 8,6 | ||
| % of total portfolio 12,4% |
| Offices | |||||
| New lettings | 9 485 | 2,5 | 8,4 | ||
| Renewals | 7 770 | 3,1 | 8,9 | ||
| Total | 17 255 | 2,8 | 8,6 | ||
| % of total portfolio 2,3% | |||||
| Total lease activity | 112 550 | ||||
| % of total portfolio 14,7% |
Tenant profile
Exposure to top 10 retailers
| Rank | Tenant | % of total GLA |
% of total income |
||||
| 1 | Massmart Group | 7% | 4% | ||||
| 2 | Edcon Group | 6% | 5% | ||||
| 3 | Pick n Pay Group | 6% | 2% | ||||
| 4 | Woolworths Group | 5% | 2% | ||||
| 5 | Foschini Group | 4% | 5% | ||||
| 6 | Mr Price Group | 3% | 4% | ||||
| 7 | JD Group | 3% | 2% | ||||
| 8 | Shoprite Holdings | 3% | 1% | ||||
| 9 | Truworths Group | 2% | 2% | ||||
| 10 | Food Lovers Market | 2% | 1% |
Weighted average rental*
| Business segment | 2012 Rental (R/m2) |
2011 Rental (R/m2) |
||
| Canal Walk - retail | 236 | 221 | ||
| Clearwater | 182 | 167 | ||
| The Glen | 189 | 177 | ||
| Woodlands | 148 | 138 | ||
| CapeGate - Value | 88 | 88 | ||
| CapeGate - Regional | 126 | 110 | ||
| Hyde Park - retail | 291 | 266 | ||
| Rosebank Mall | 182 | 174 | ||
| Atterbury Value Mart | 133 | 124 | ||
| Willowbridge - retail | 96 | 101 | ||
| Stoneridge | 73 | 73 | ||
| Somerset | 102 | 97 | ||
| Offices | 110 | 106 |
* Includes basic rent and operating costs.
Tenant profile by grade
| Tenant grading by GLA | Tenant grading by income | |||||
 |
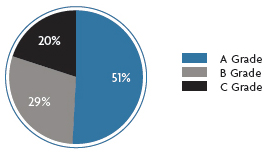 |
Tenants in the portfolio have been categorised by grade as follows:
A Grade: Large national tenants, large listed tenants and
major franchisees (including all national retailers and
tenants part of large listed groups)
B Grade: Smaller national tenants, medium sized franchisees,
medium to large retailers
C Grade: Smaller line stores
Due to the nature of the Hyprop portfolio, the above categorisations are largely subjective.
neW technoLogy
During the year Hyprop has sought to introduce technology advancements to help drive footfall and increase dwell time. This included the introduction of mobile applications at all shopping centres on the back of the Canal Walk application which was launched in 2011. The use of new technology is also designed to improve the customer experience. All centres have a presence on social media via Facebook and Twitter.
Online retail in South Africa has not reached a level of sophistication
to impact significantly on our centres. Internet connectivity remains
slow and is only available to a small percentage of consumers.
at the moment there is also no significant price advantage in buying
goods online. However consumers are increasingly using social media
and mobile content to research products and we are focusing on
increasing our marketing foothold in this area.
proSpectS
Hyprop will continue to focus on growing assets through acquisitions and the expansion of existing centres to meet tenant demand. Investment in dominant shopping centres, both locally and elsewhere in Africa, will remain our primary objective. Given the right opportunities, the company will continue to dispose of non-core assets.
Taking into account the short-term dilution due to the Rosebank Mall redevelopment, Hyprop expects to show distribution growth of between 5% and 7% for 2013.
appreciation
I wish to extend my thanks to the board for their wise counsel and particularly to our Chairman, Michael Aitken, for his years of service to Hyprop. I thank the executive team and all our employees for their hard work and dedication. My appreciation to our tenants for their continued support in challenging economic times.
Pieter Prinsloo
CEO


FeedbackWe would welcome your feedback on our reporting and any
suggestions as to For further detail and information, please visit www.hyprop.co.za |
|
